FTR Mark-to-Market Analysis Tool
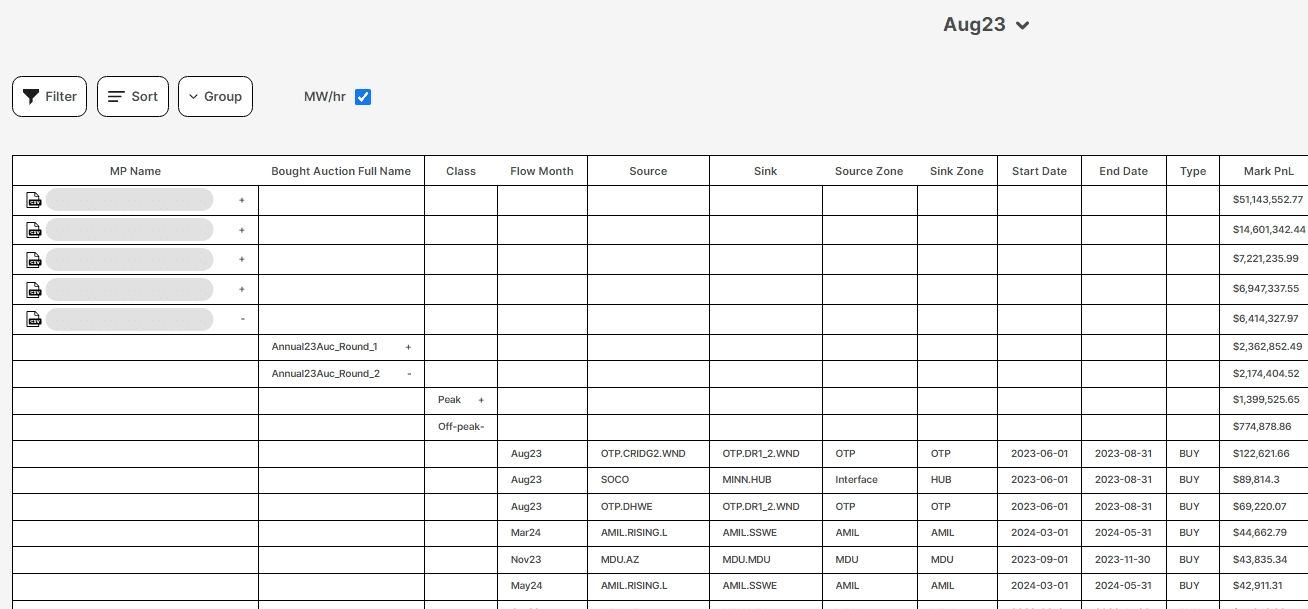
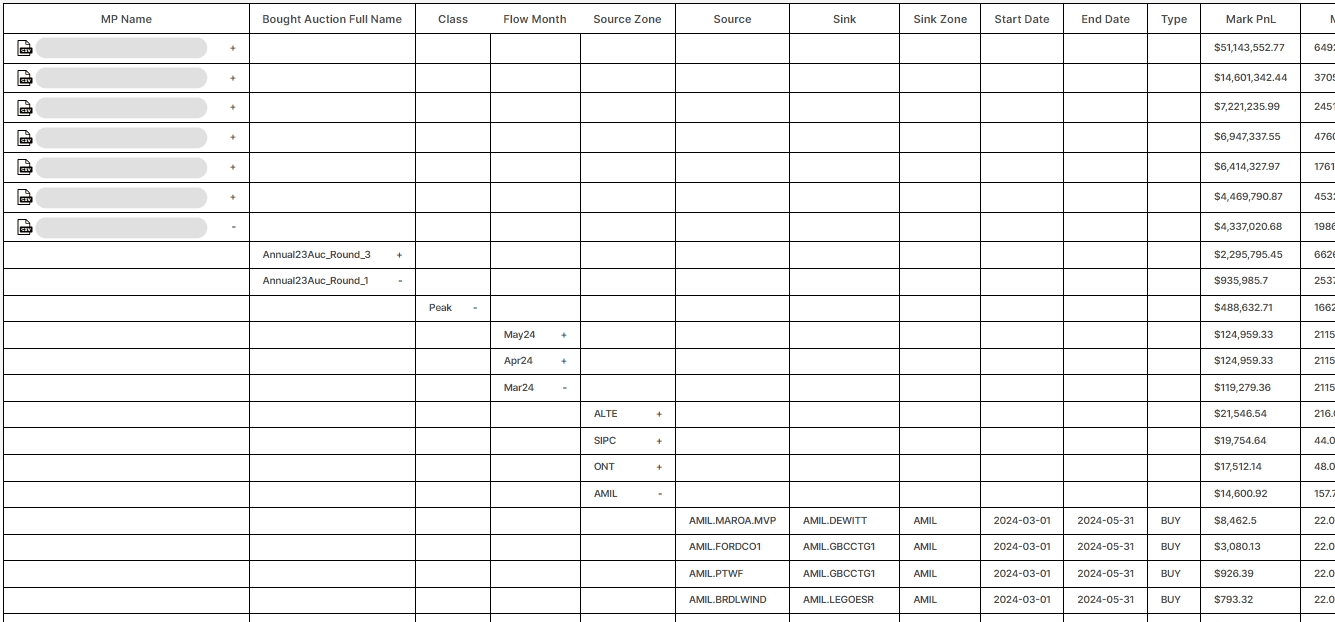
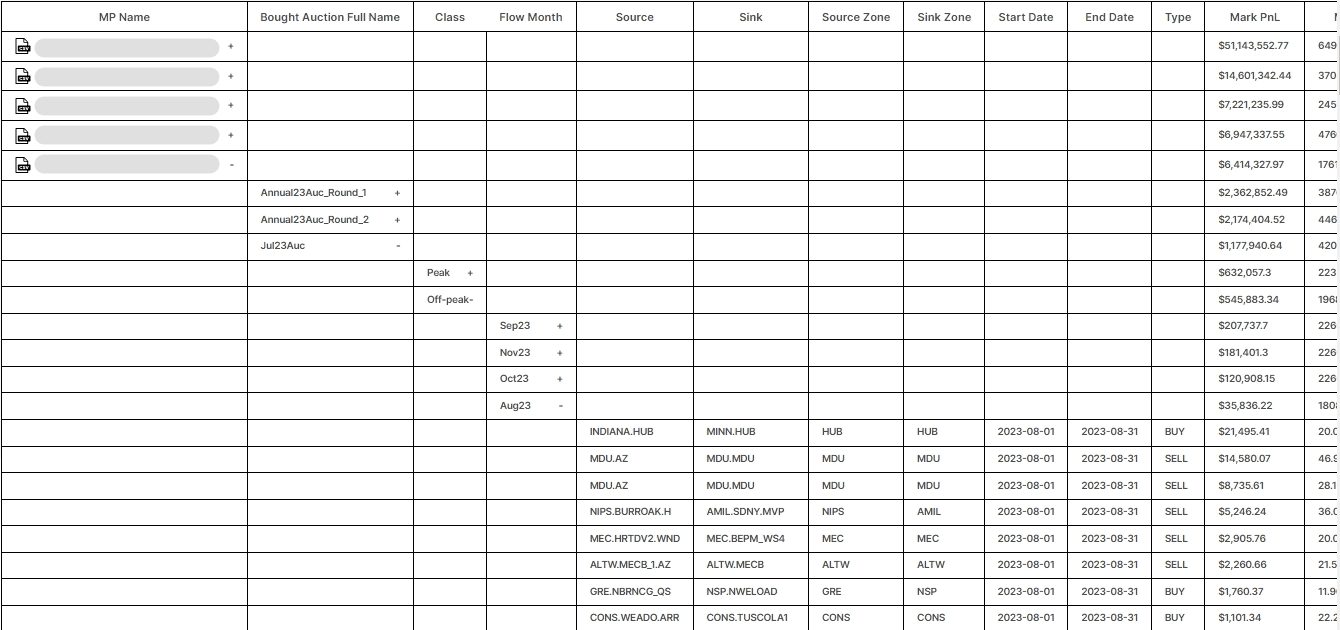
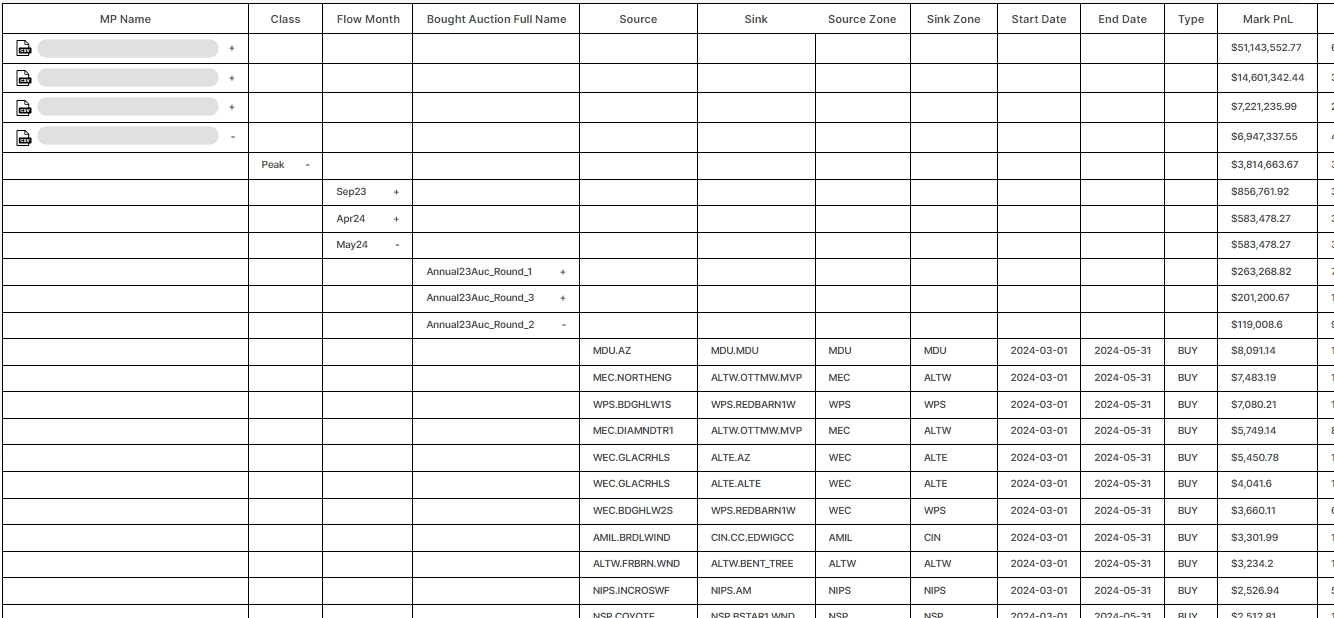
Evaluate your portfolio's mark to market value or analyze other participants' mark.


Source-Sink zone

Flow Month

Buy Auction
Our tool provides in-depth analysis of the mark to market value of the MISO FTR Auction whole market position. Break it down by market participants, source/sink zone, bid price levels, buying auctions and much more to understand where the market is marked up or down.
Get To Know About Our Features

Comprehensive Data Representation
We cover the whole MISO FTR Auction data. From history to current and from participants with 0.1 MW to the largest holder. Visualize the data with our interactive tables and charts.

Advanced Calculations
Our tool simplifies tracking PnL for you by providing the Original Mark (marked from original buy price) or New Mark (marked from last auction).

Historical Data
Turn the wheel back and check how the market mark value changed in history auction over auction.

Customizable Reports
Generate customizable reports to suit your specific needs. Choose between various data formats and visualization options to get the information that matters to you.

Comprehensive Data Representation
We cover the whole MISO FTR Auction data. From history to current and from participants with 0.1 MW to the largest holder. Visualize the data with our interactive tables and charts.

Advanced Calculations
Our tool simplifies tracking PnL for you by providing the Original Mark (marked from original buy price) or New Mark (marked from last auction).

Historical Data
Turn the wheel back and check how the market mark value changed in history auction over auction.

Customizable Reports
Generate customizable reports to suit your specific needs. Choose between various data formats and visualization options to get the information that matters to you.

© 2021 Isostats. All rights reserved.